Hello guest,
Thank you for subscribing to our newsletter! We hope you enjoy the third edition chronicling recent developments of our website.
Our first newsletter discussed the AutoCluster feature followed by the second newsletter discussing AutoTree.
This newsletter will discuss the AutoPedigree feature which is a tool that employs AutoTree predictions (available for Ancestry and FamilyTreeDNA profiles).
In short, AutoPedigree automates the generation and testing of hypotheses using the reconstructed trees from AutoTree.
It is developed to identify how a person, for instance an adopted person, fits into a reconstructed AutoTree.
Our approach has been inspired by the WATO tool that has been built to help solve DNA puzzles
(including unknown parentage cases) by undertaking calculations as described by Leah Larkin in her series Science the heck out of your DNA.
Before we can explain AutoPedigree, we need to cover some basic DNA statistics. One of the key aspects of AutoPedigree is how probable a certain match is (also represented with a probability).
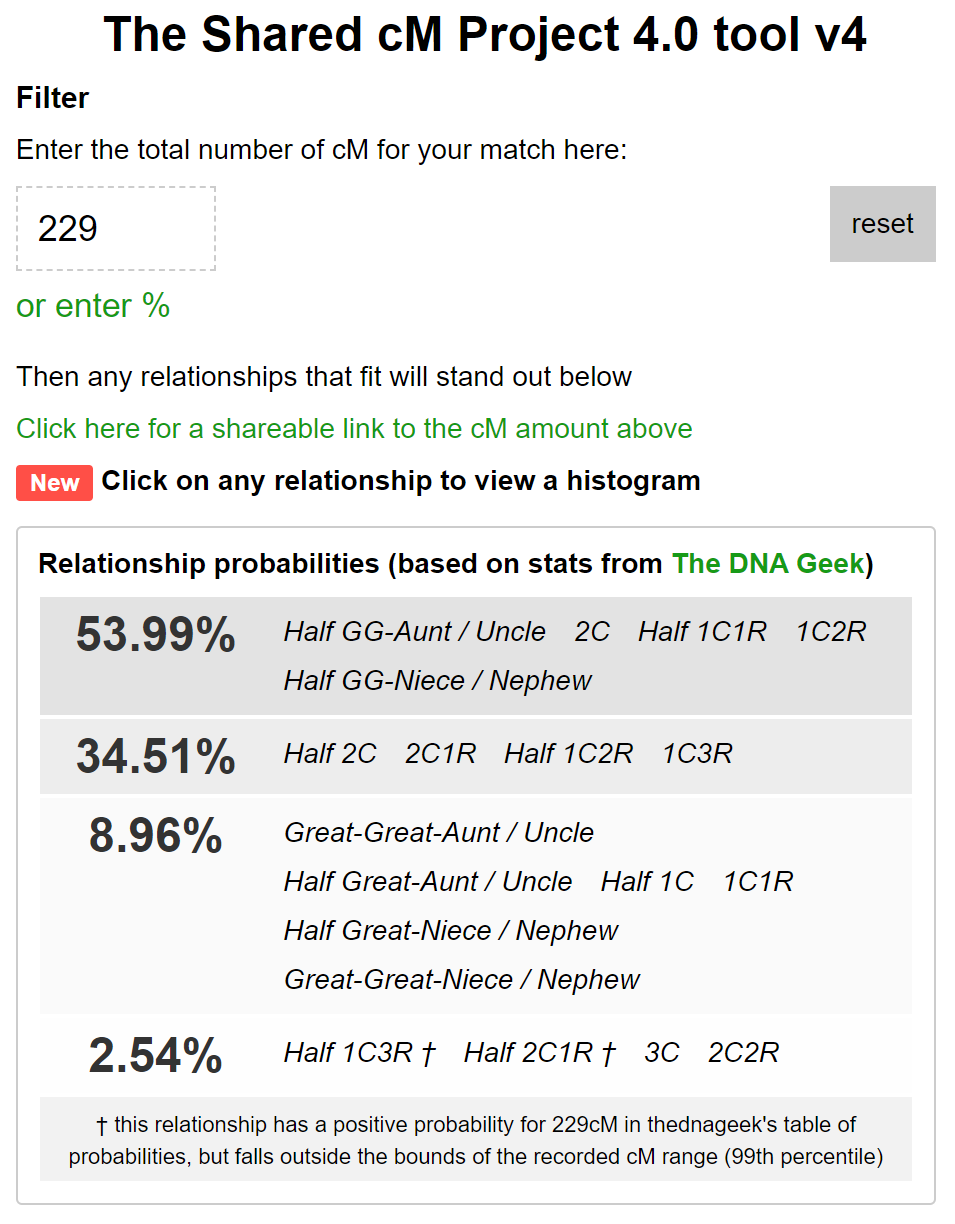
For instance, a DNA match that shares 229 cM has a 54% probability of being a 2C and a 2.54% probability of being a 3C. These probabilities can be obtained by using the Shared cM project 4.0 tool. The probabilities used in that site are also used by WATO and our AutoPedigree approach.
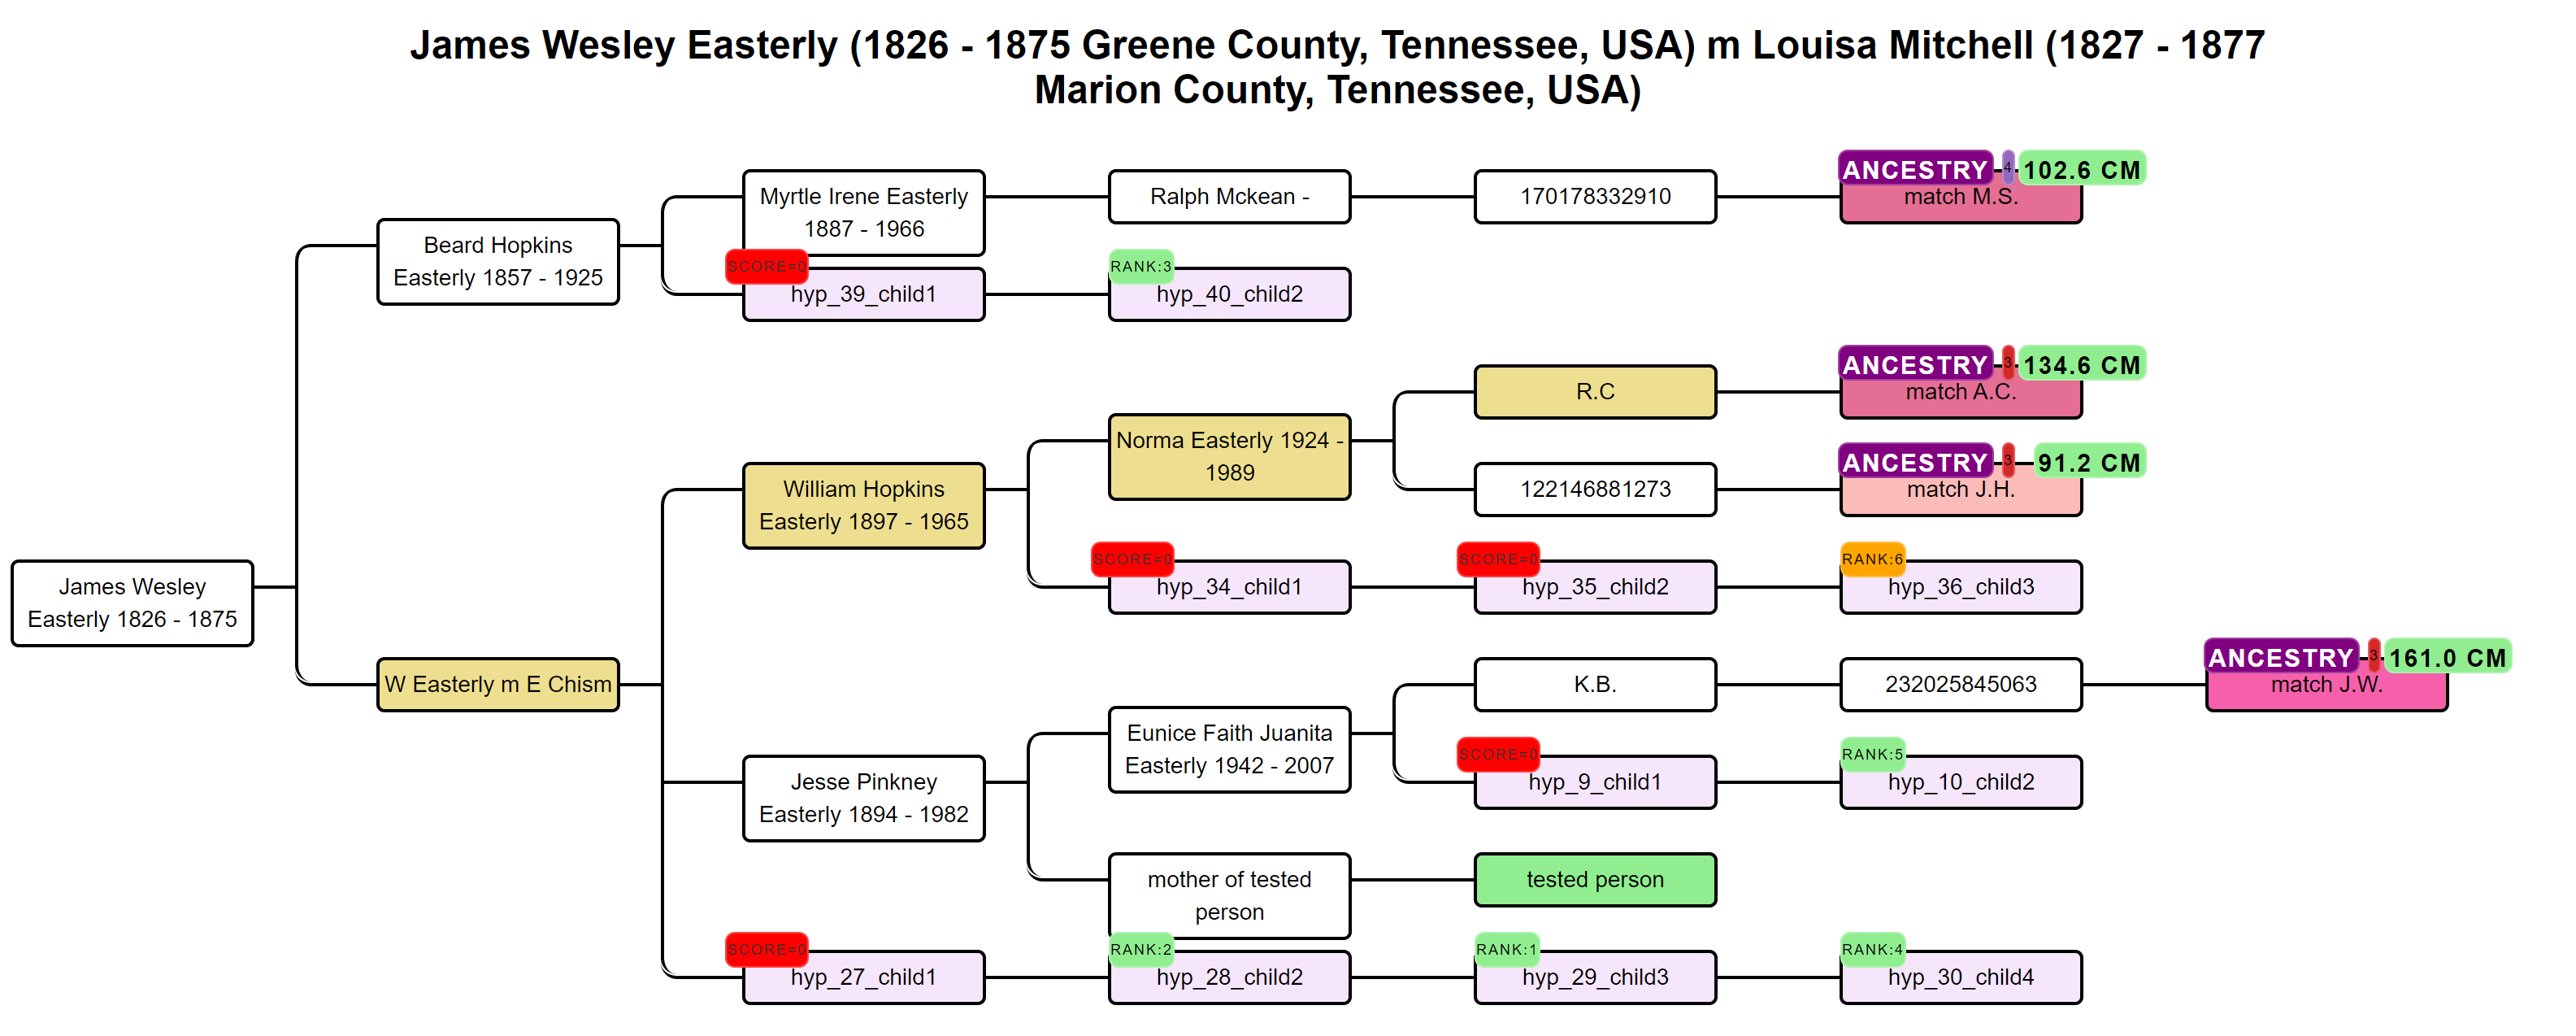
 Based on the common ancestors from the reconstructed trees, we create siblings for each of the identified ancestors. Next, we generate descendants (also called hypotheses) that could each serve as a hypothesis. What that means is the following, each generated descendant could represent the actual test taker (for instance an adopted person). But given the cM values of the DNA matches in the tree, some generated descendants are more probable than others. Remember the probabilities from the shared cM project that were just discussed? We use these probabilities for each DNA match and their shared cM in combination with the genealogical path to calculate how likely a certain relationship is to occur. Using the probabilities based on several DNA matches we can then score how likely certain scenarios are.

How does that calculation work for every scenario? Given a certain hypothesis, we multiply the probabilities for each of the DNA matches in the tree and calculate a score. We perform this calculation for many generated descendants and rank them based on the combined probabilities.
All generated AutoPedigree trees are available in the WATO format, allowing users to import them into WATO. This allows for further tweaking of the trees, for instance correcting mistakes if the AutoTree wrongly identified a common ancestor. Also, additional matches from other companies that are known to be descendants from the MRCA can then be added as well, to improve the predictions.

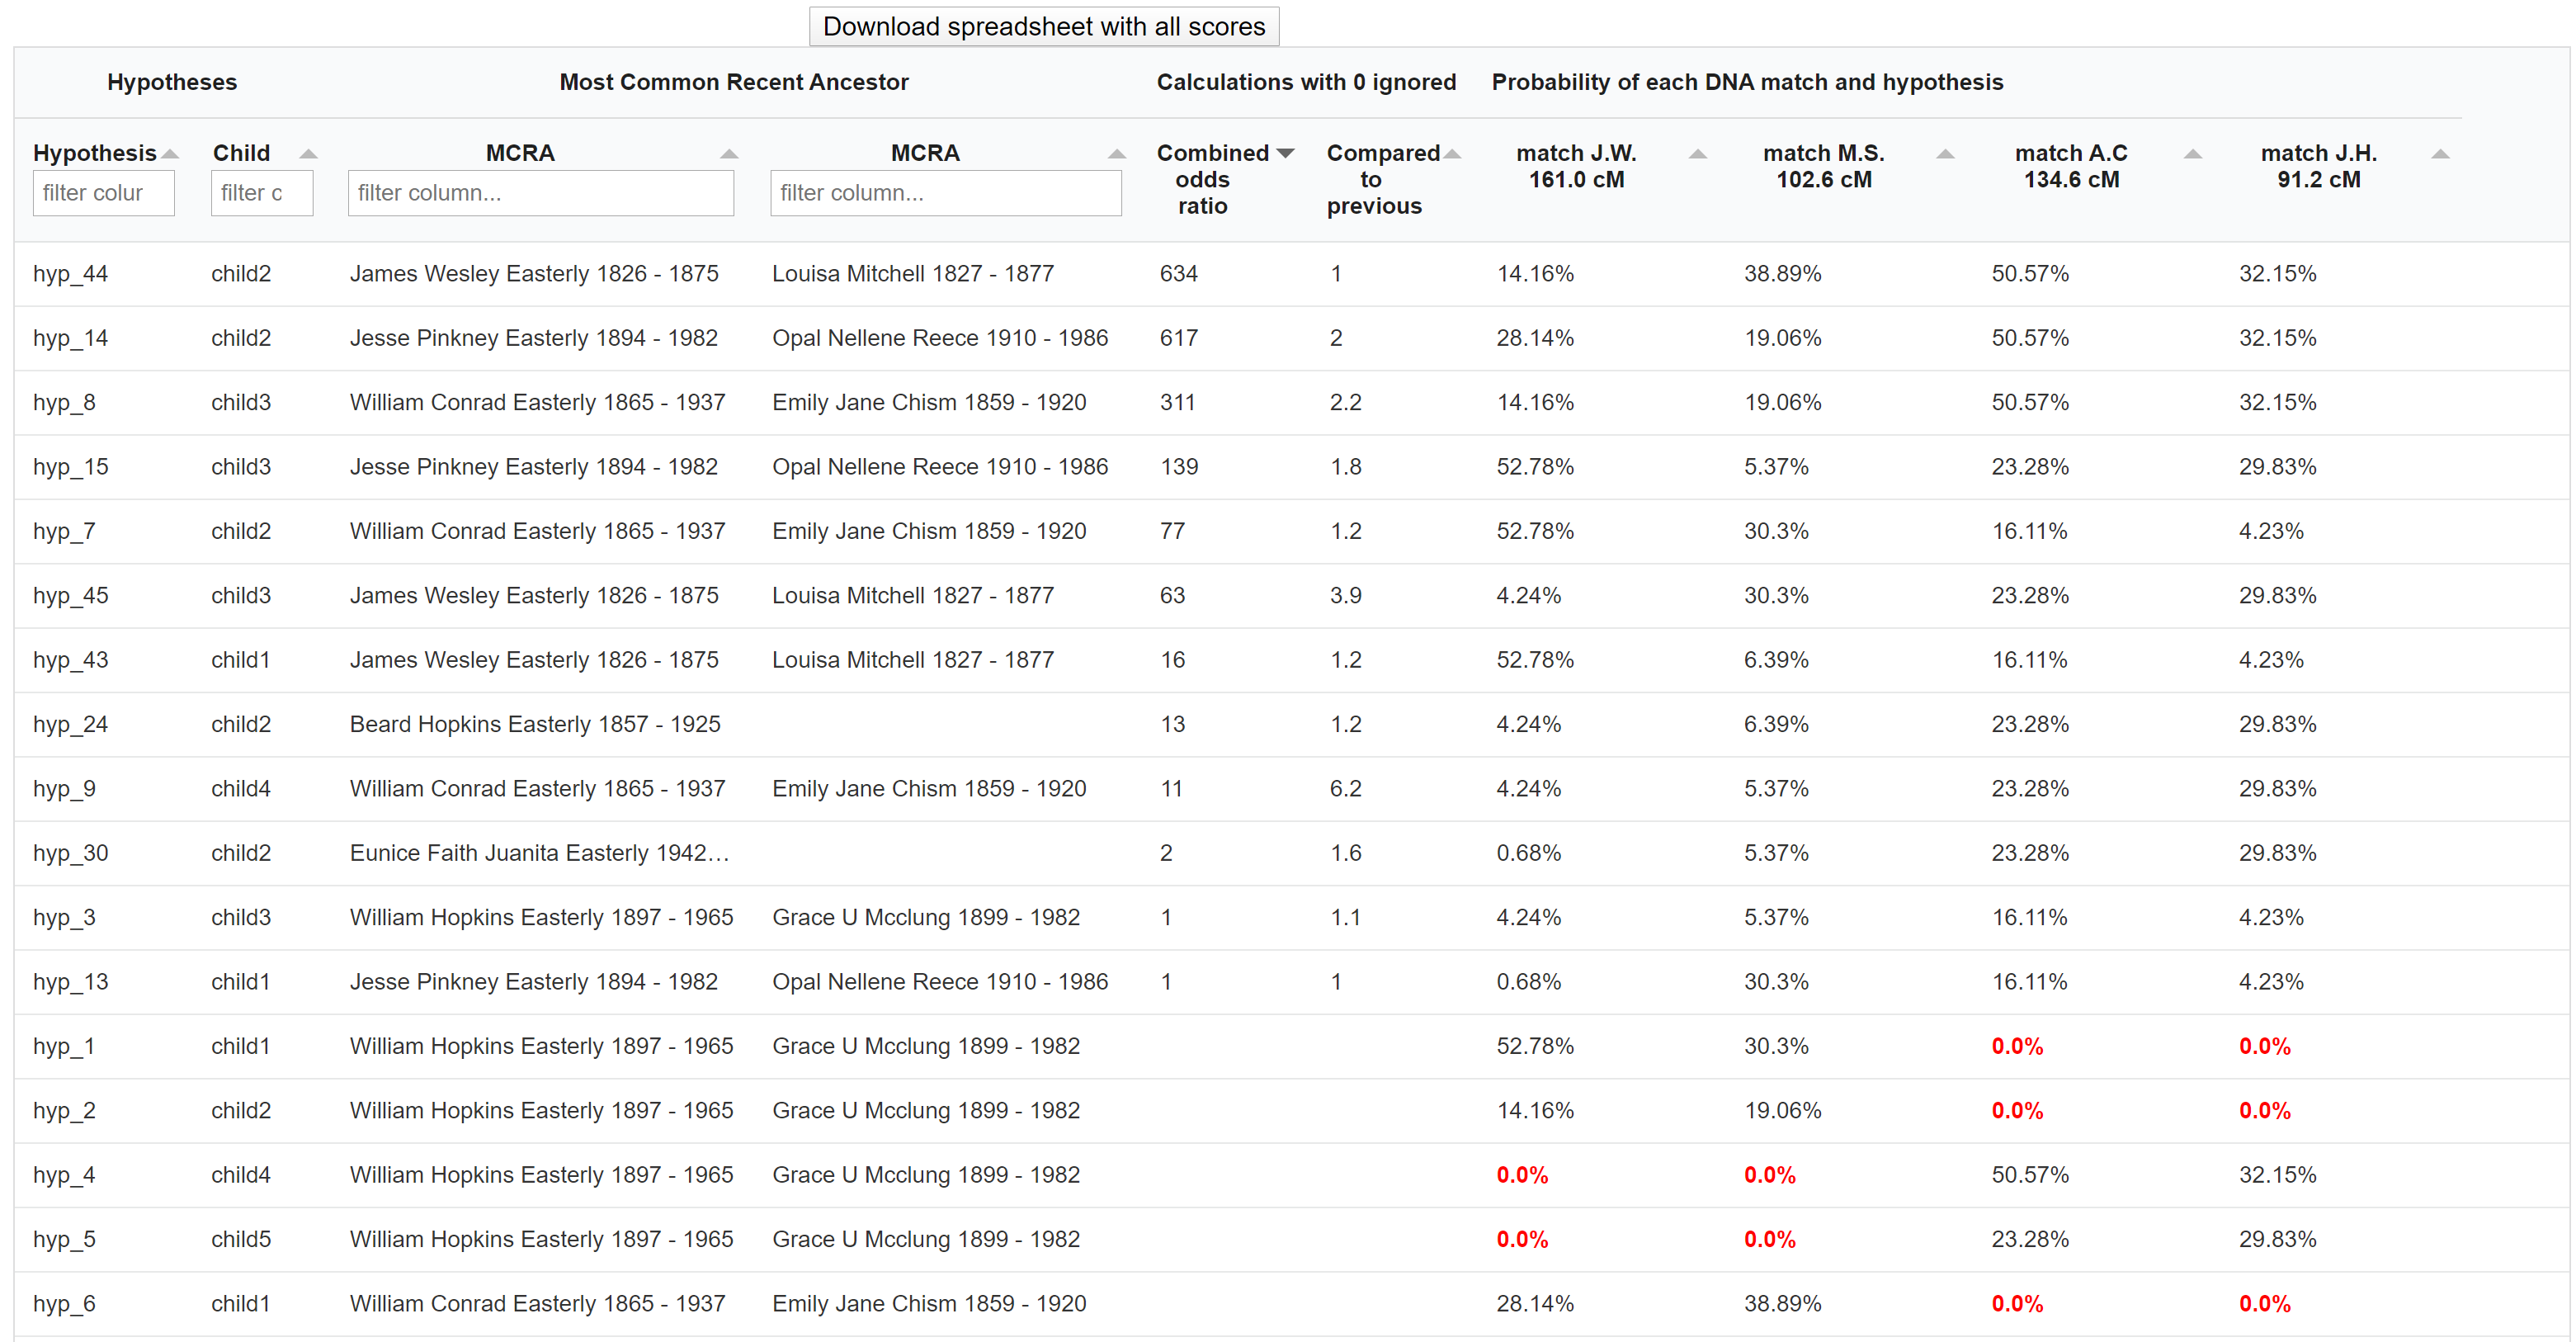
The table underneath the visualized AutoPedigree tree summarizes the different hypotheses. Each row represents a hypothesis, the MRCA, and the ranked combined odds ratios. This odds ratio score is calculated based on the probability of that hypothesis divided by the smallest probability of all generated hypotheses. Next, we compare the ranked scores and calculated the ratio between hypotheses. For instance, if the best-combined odds ratio is 200 and the second best is 50, the compared score would be 4 (200 divided by 50). The last columns show the probability of each DNA match for the generated hypothesis.
Some hypotheses contain probabilities that are 0.0%, indicating that this relationship is not possible when taking into account the cM value of the DNA match and the proposed genealogical link. For instance, a DNA match that shares 200 cM cannot have a relationship of a 4C.
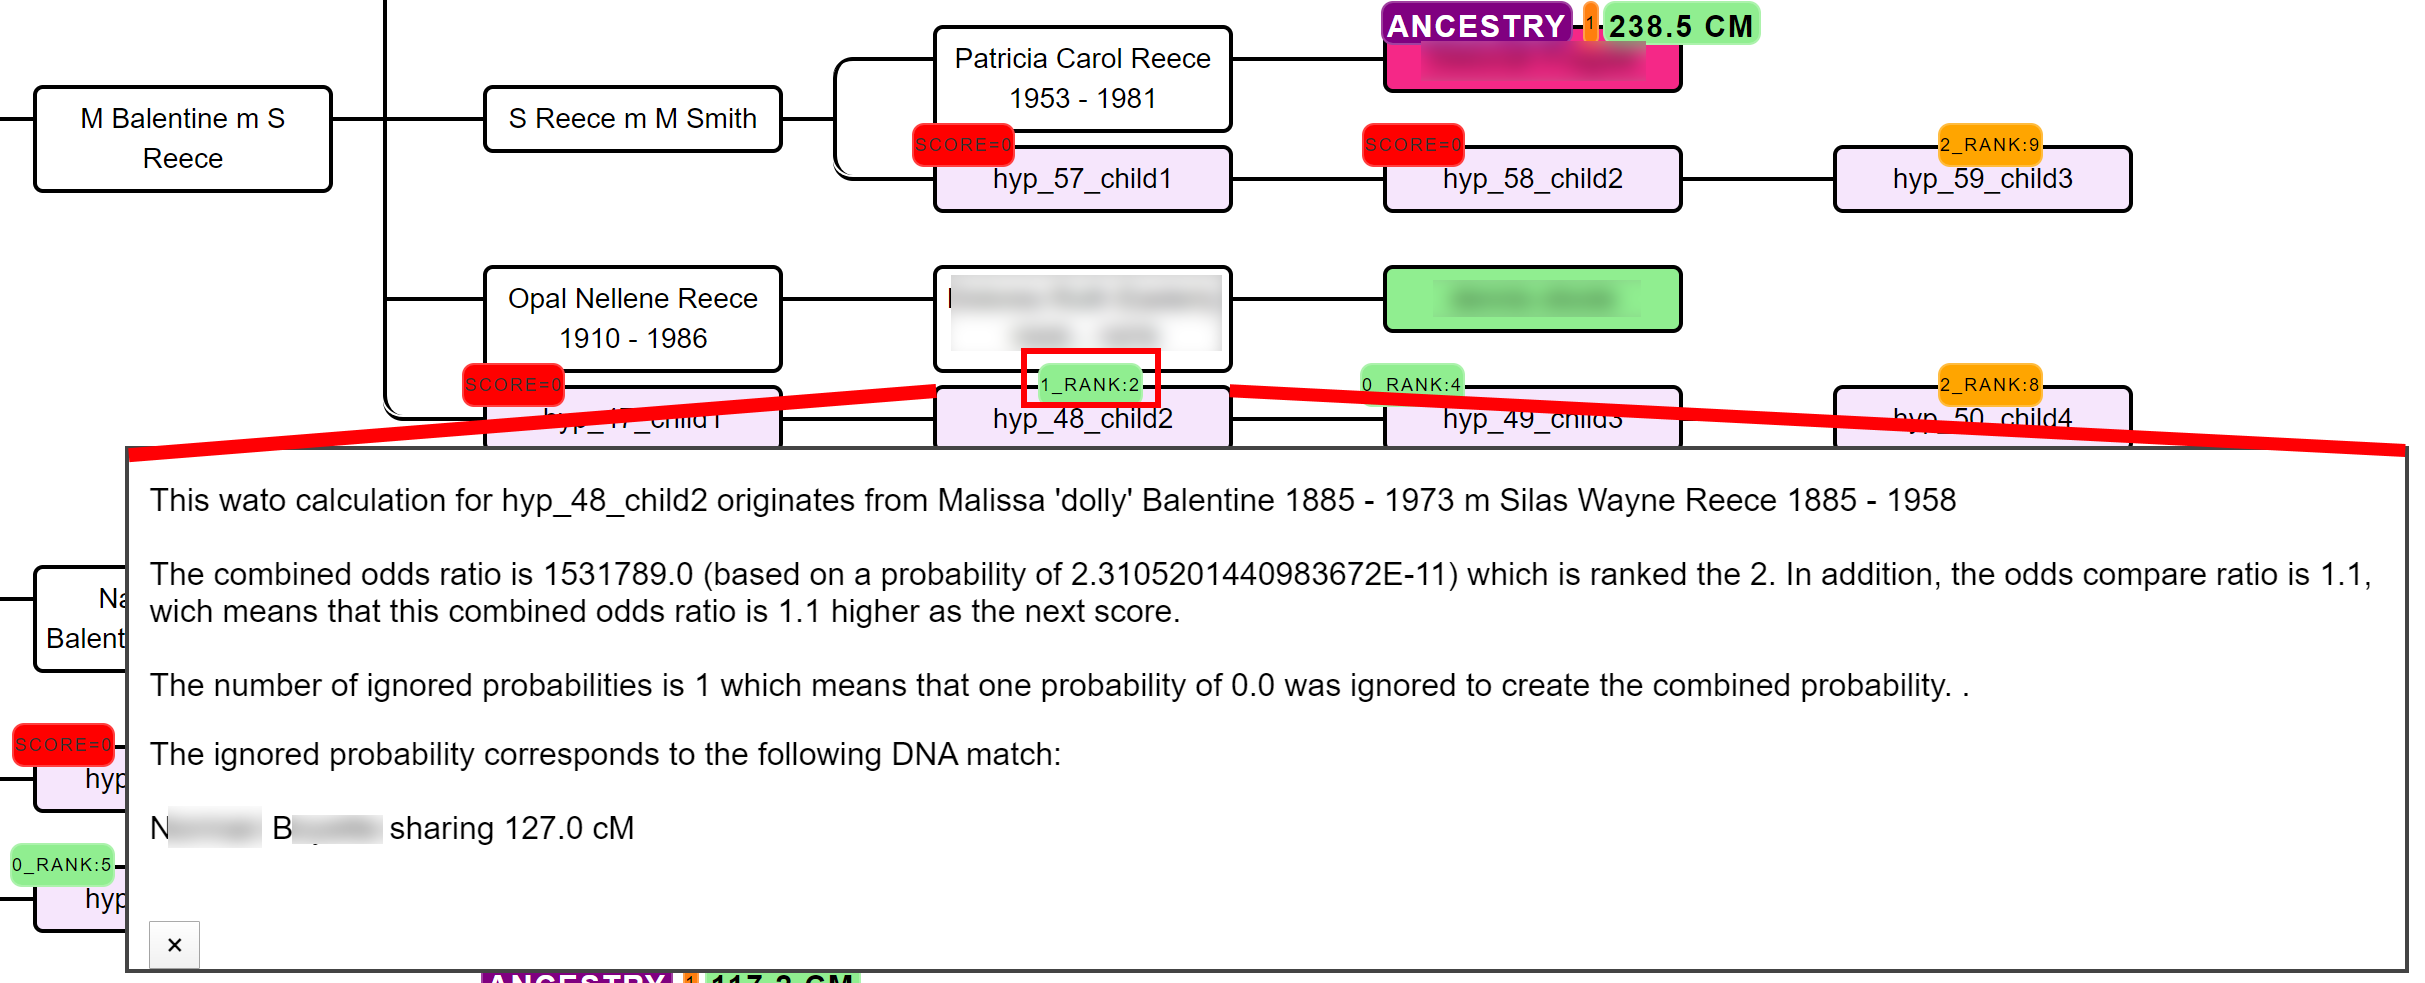
The generated hypotheses are visualized as descendants in the reconstructed AutoTree visualizations. For instance, hyp_14_child2 represents the 14th hypothesis and the second child. Instead of supplying the scores, we provide the rank of the score in a badge since small scores can sometimes cause unwieldily high scores. Scores that have a probability of 0 are placed in a red badge, the top 5 scores are placed in a green badge and the remainder of the scores is placed in an orange badge. Upon clicking on the badge, a popup will appear that holds more information concerning the calculation of the score.
A lot of hypotheses are tested for AutoPedigree. Therefore, to improve the visibility, we prune the AutoTree tree by only displaying generated descendants if positive probabilities are available for that branch.

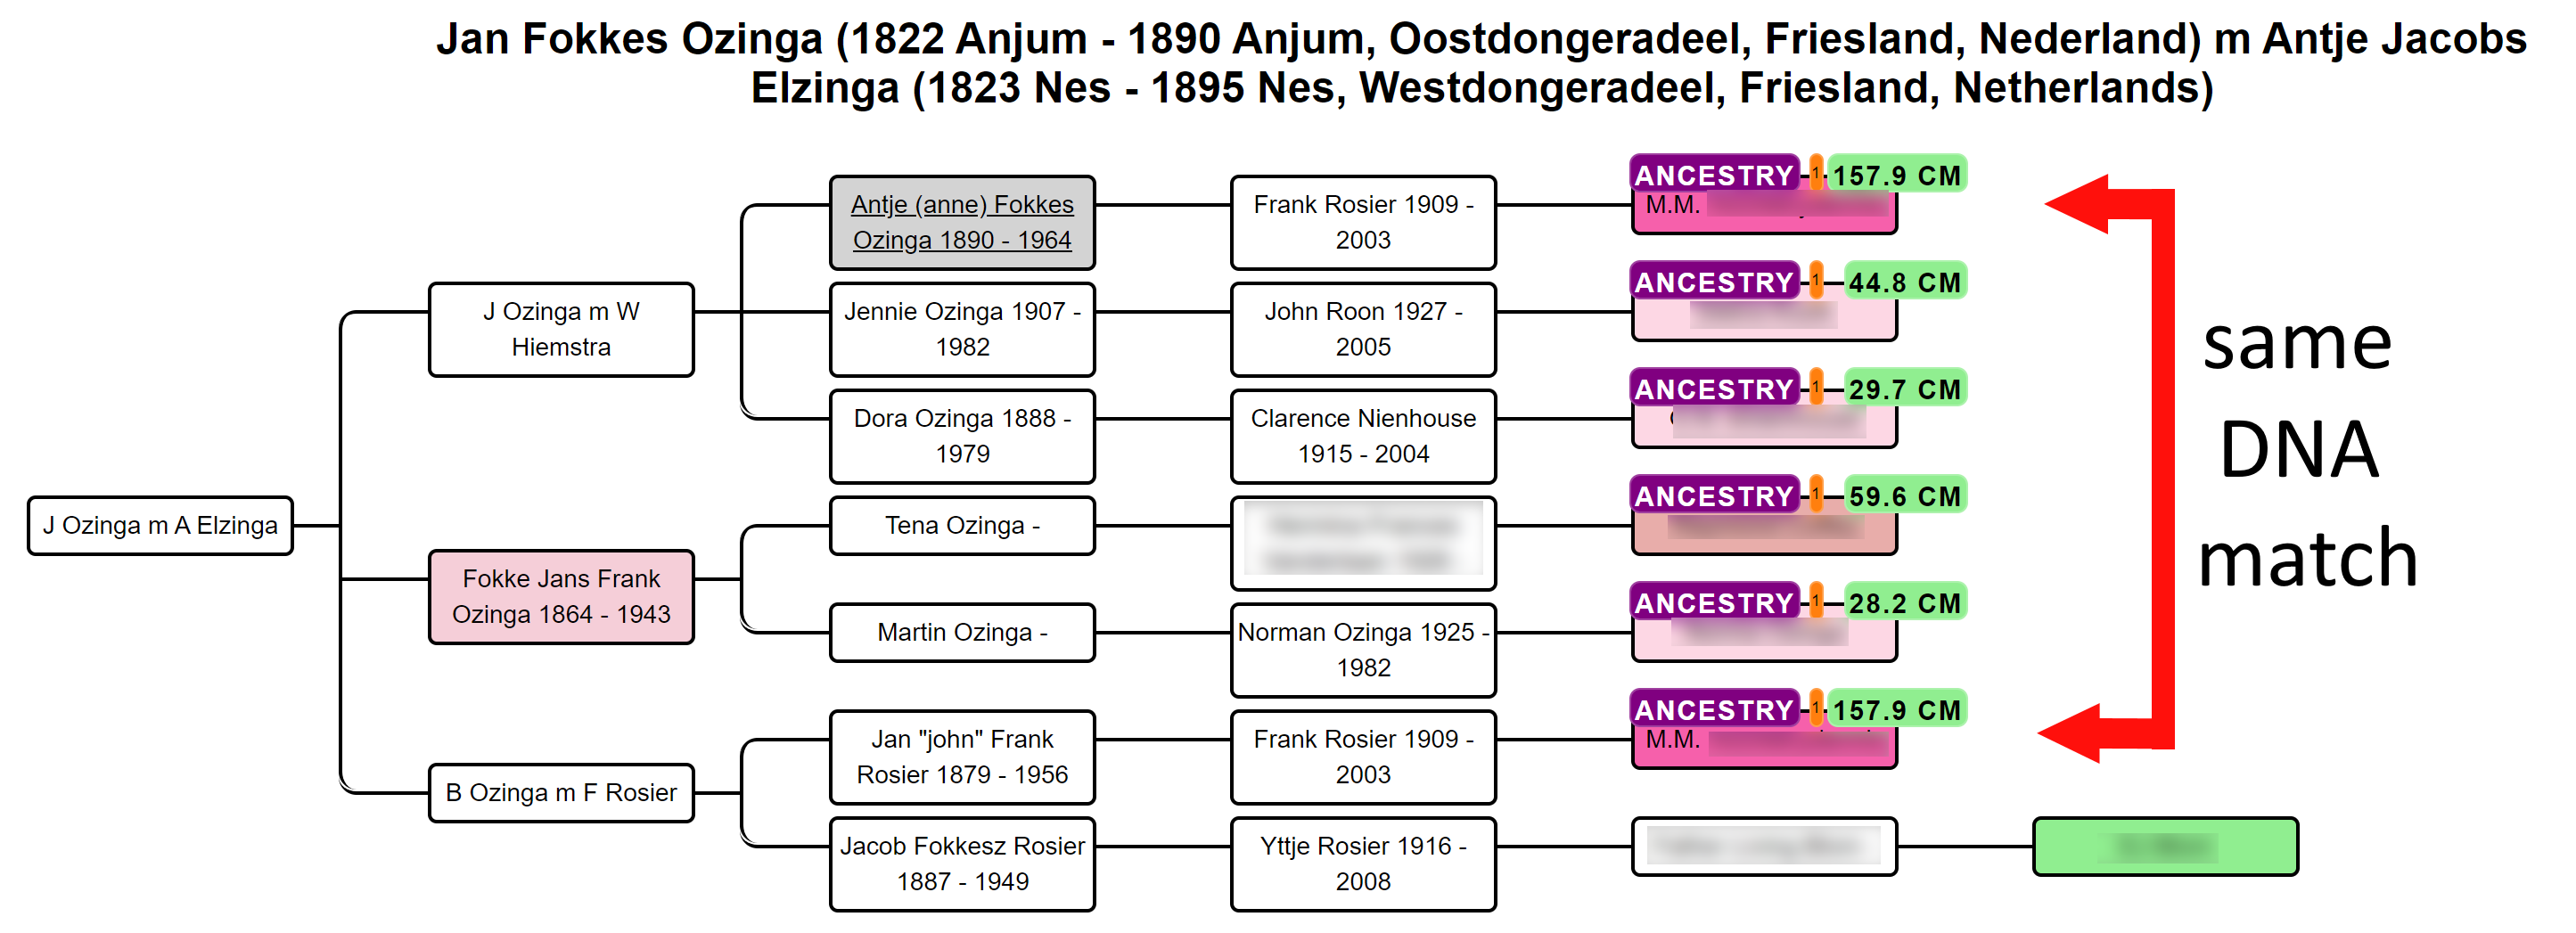
In some cases, a DNA match has multiple links with the tested person, for instance, DNA match M.M. that shares 157.9 cM has common ancestor J Ozinga and B Ozinga. The amount of cMs that is shared with the tested person is therefore inflated. To correct for this, we employ an approach that divides the amount of shared cM based on the different genealogical paths. We, therefore, attribute a larger fraction of cM to the DNA match if the tested hypothesis has a shorter path to the hypothesis as compared to the other path(s). Despite this measure, caution should be taken when encountering these DNA matches. The grey cells in the AutoCluster charts can also be indicative of matches that are linked to more clusters and therefore linked via multiple ancestors.
A single inaccurate probability from a recalcitrant DNA match can potentially nullify the overall hypothesis, making its score zero.
Unfortunately, these hypotheses are sometimes inevitable, for instance, because a match is related via multiple genealogical links whereas only one line is identified. In this case, you might end up with a predicted 4C (based on the reconstructed tree) that shares much more DNA with the tester as is expected based on the 4C relationship. Another reason we encountered is when the AutoTree incorporates a DNA match in the overall tree based on wrong assumptions, for instance, based on an unlinked tree.
If necessary, we therefore also perform the same automated analysis while ignoring one or two of these cases. If the rank badge starts with a digit, this digit will represent the number of ignored probabilities (2_RANK:4 indicates a hypothesis ranked 4th for which 2 probabilities were ignored). By clicking on the badge that holds the rank, information is provided concerning the score as well as the DNA match(es) that was ignored.
Invoking the AutoPedigree can be accomplished by going to the AutoCluster or AutoTree interface. Select the common ancestor (AutoTree) option as well as the AutoPedigree. Next, select the min cM threshold for the analysis. This threshold indicates the minimum of shared cM that a match should share with the tested person. It is advised to use a 40 cM limit but it is possible to go down to 30 cM.

Disclaimer. Although care has been taken in reconstructing the trees and linked probabilities, please remember that these are the result of automated methods. There is no guarantee that all possible common ancestors are correctly identified. Please verify all tree data and match characteristics at the original sites.
Common mistakes are for instance common ancestors that have not been combined properly and are visualized as two different common ancestors.
Moreover, while our approach tries to correct for matches with different genealogical paths, having these DNA matches will affect the resulting probabilities.
See also our manual for more information.
We have a Facebook user-group that offers support from many experienced users and where
interesting use cases are discussed.
Good luck with your genetic genealogy journey!
Best regards,
Evert-Jan Blom
Terms of Service & Privacy Policy
& Website & Member login & Facebook & Unsubscribe to our newsletter
''
|